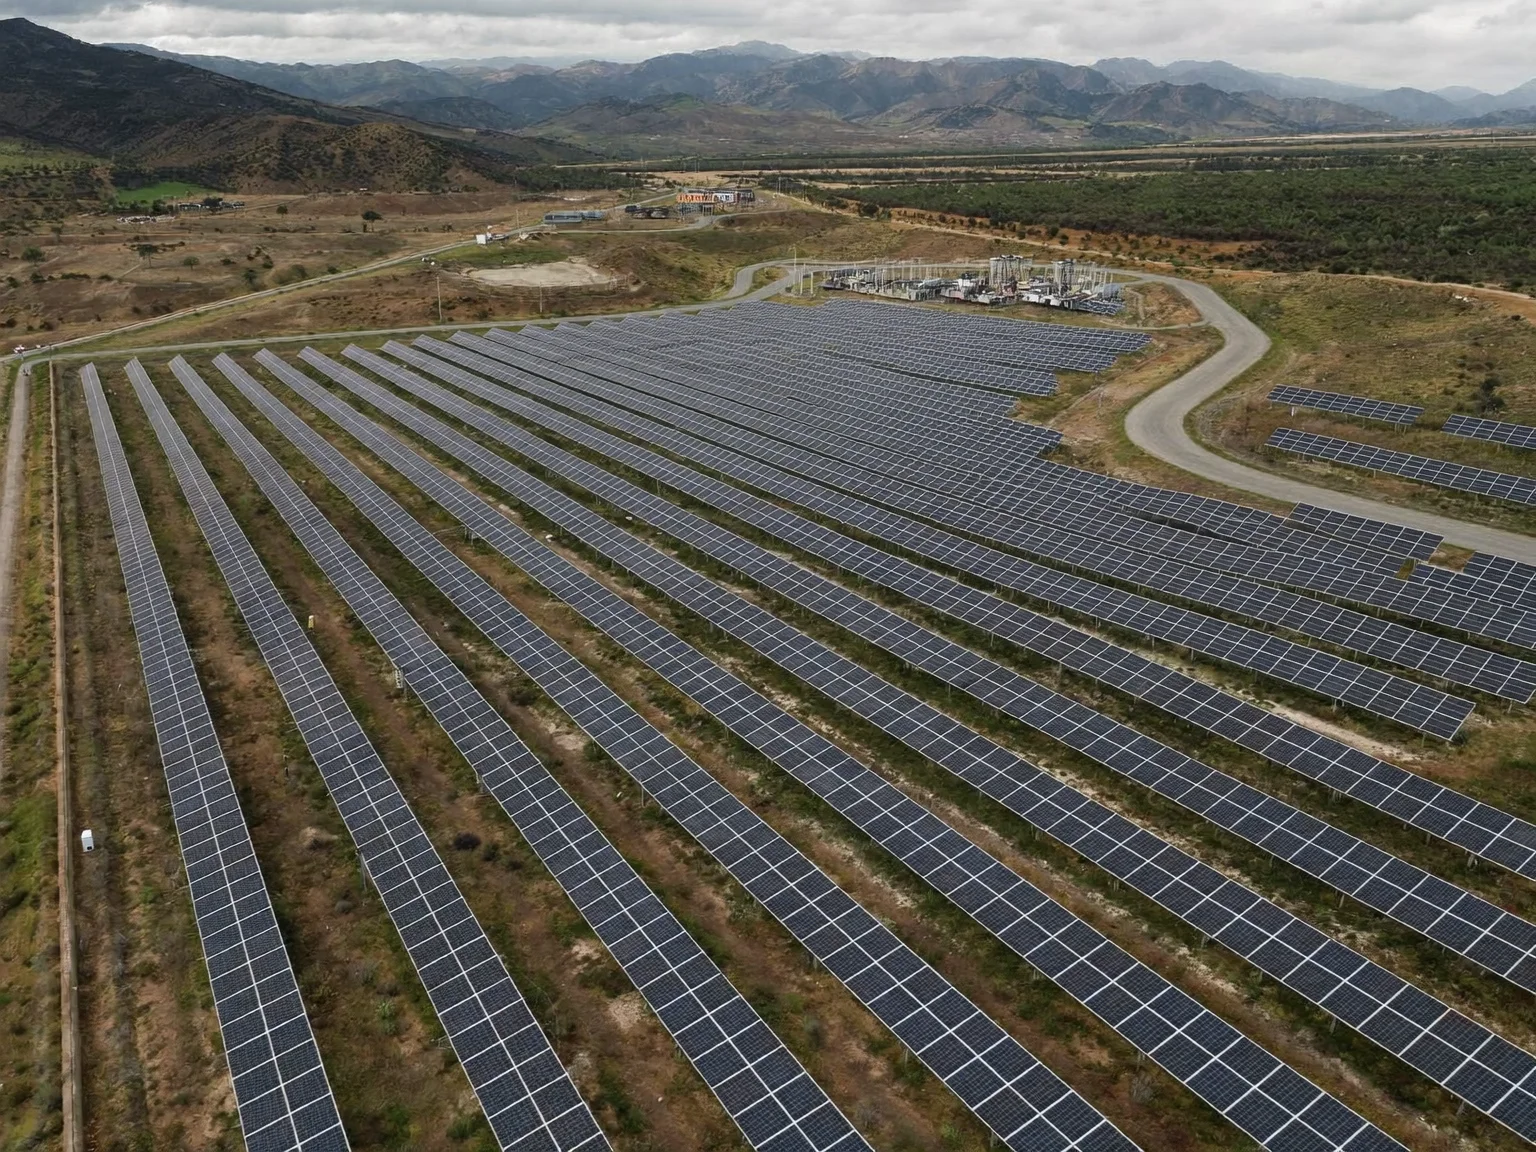
For solar owners and O&M teams, control.io runs drone thermal and RGB inspections of PV plants. Anomalies are classified in the style of IEC TS 62446-3, each one is geo-tagged to its module, and the result is a ranked defect list and PDF report your field crew can work through row by row.
Last updated
Problems and answers
Thermal and RGB drone inspection of solar farms, with every anomaly pinned to a module.
- 01
The problem
Walking a large plant with a handheld camera takes days.
With control.io
A drone covers the array in a fraction of the time under consistent irradiance.
- 02
The problem
Thermal images alone are hard to act on.
With control.io
Each anomaly is paired with an RGB image and a module position on the map.
- 03
The problem
Warranty claims need documented evidence of module defects.
With control.io
Reports record the anomaly class, temperature difference and conditions at capture.
Deliverables
- Radiometric thermal and RGB imagery of the full array
- Anomaly classification: hot cells, bypass diodes, open strings, soiling, shading
- Geo-tagged per-module defect map
- Prioritised PDF report for O&M
- Year-on-year comparison of repeat inspections
What solar defects can a drone thermal inspection find?
Hot-spots from cracked or damaged cells, active bypass diodes, disconnected modules and strings, soiling and bird droppings, vegetation shading and some junction-box faults.
What conditions are needed for a thermal PV inspection?
Clear sky and sufficient irradiance on the module plane (IEC TS 62446-3 calls for at least 600 W/m²), low wind and the plant operating under load.
Do you inspect rooftop systems as well as ground-mount farms?
Yes, where airspace and roof access allow a safe flight. Ground-mount plants are the most common case.