control.io offers six drone-based services for construction and solar. Each one produces dated, hashed imagery that feeds the same evidence trail, so findings from different services can be cross-checked.
Last updated
Service 01
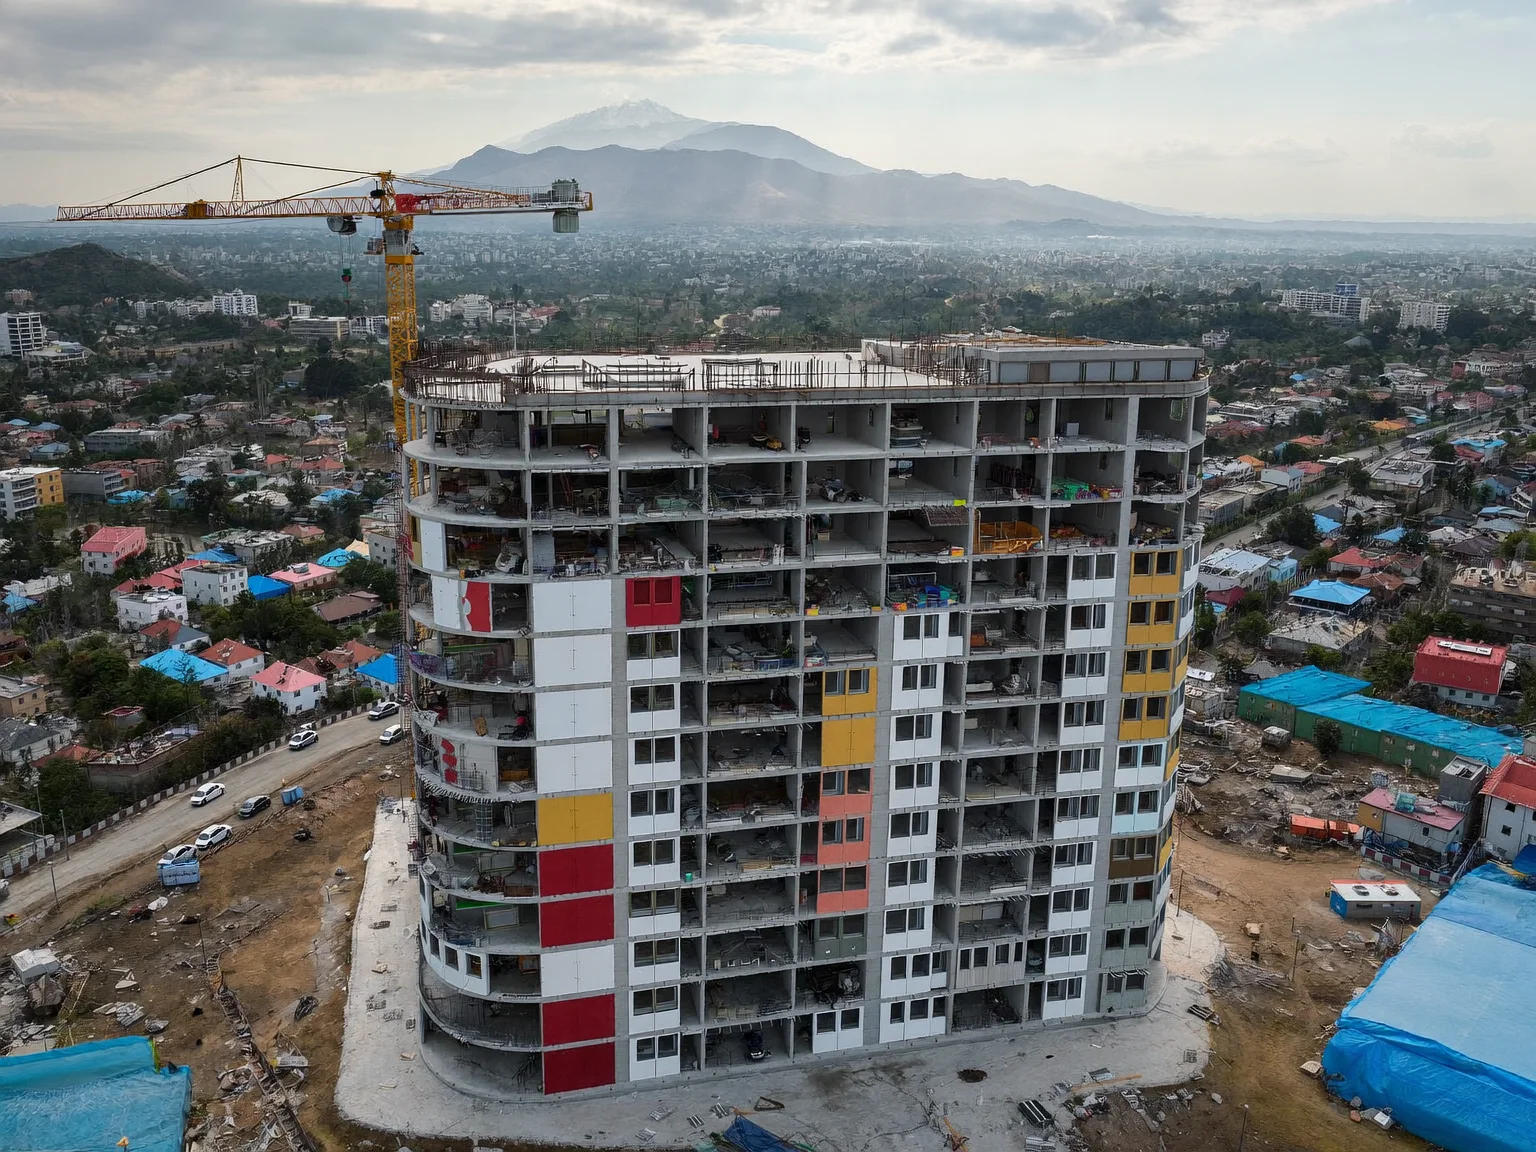
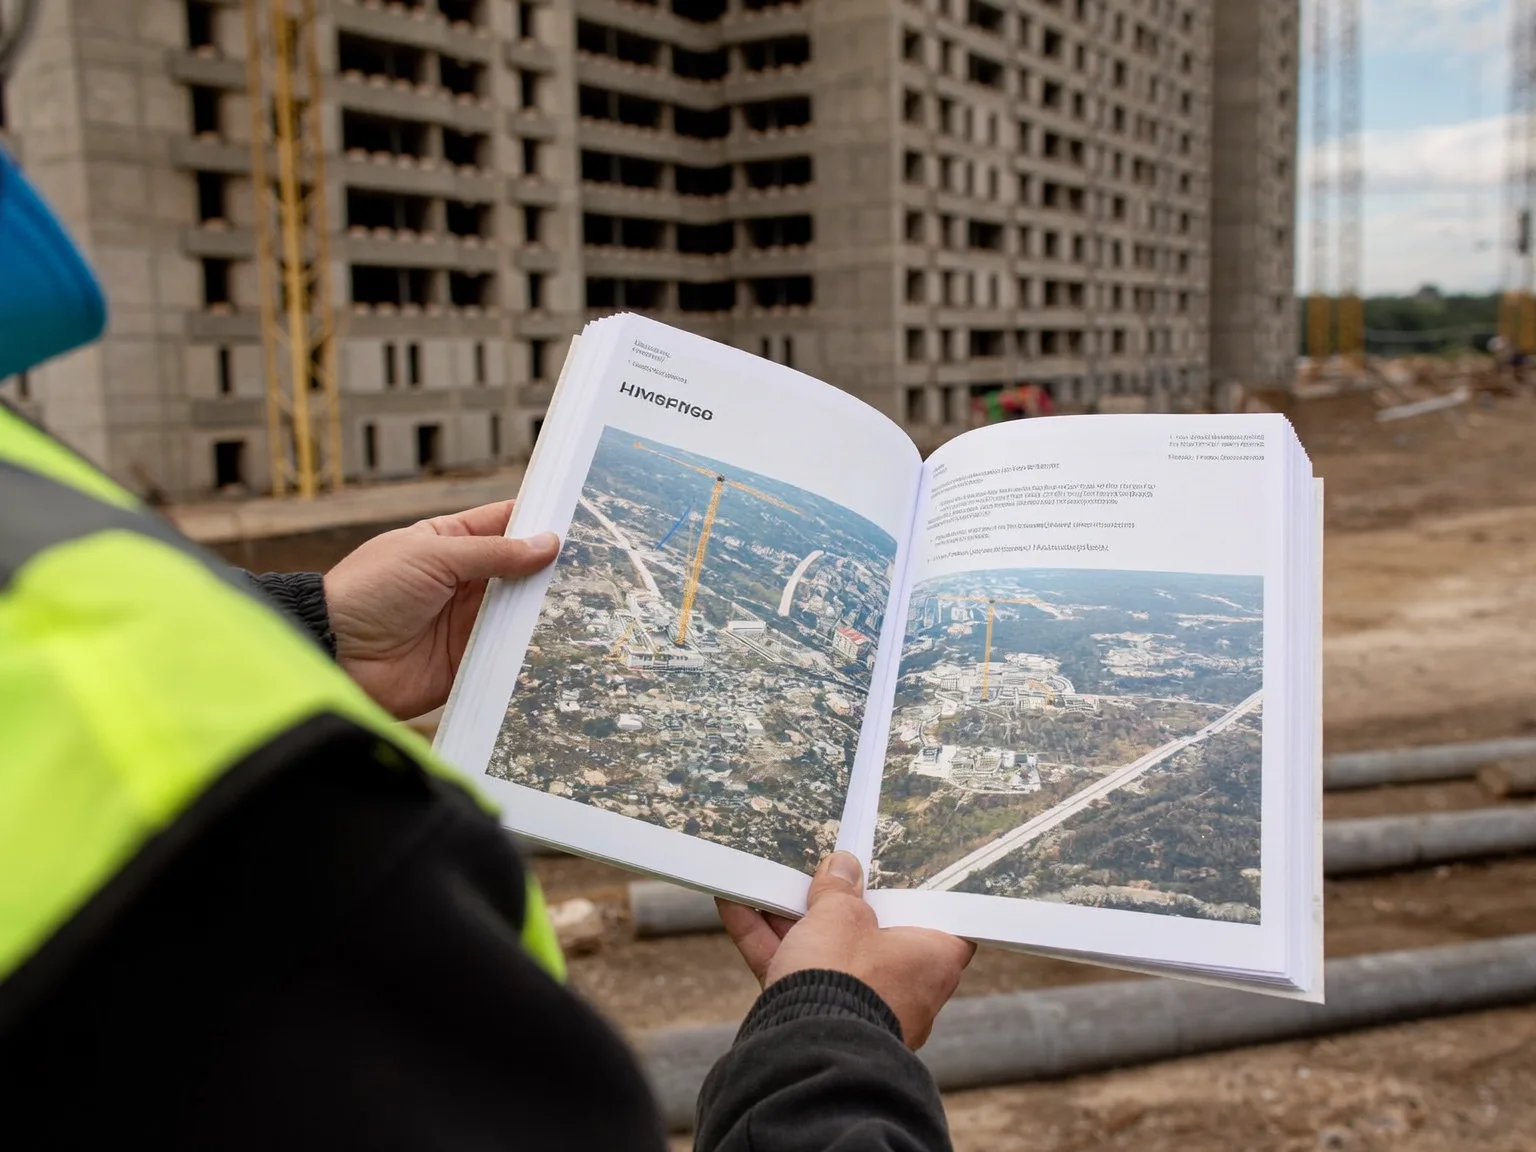
control.io flies the same route over your site on a fixed cadence, counts completed floors, slabs and envelope panels in the reconstruction, and compares them with the baseline programme. The output is a per-floor, per-trade verdict: on track, watch or late, with the number of days behind.
- Per-floor verdictsEach storey and trade gets a status and a day count, not a vague percentage.
- Same route every flightRepeatable flight paths make month-to-month images directly comparable.
- Earned schedule, not guessesProgress is converted into schedule time so a slip reads as days behind.
Service 02
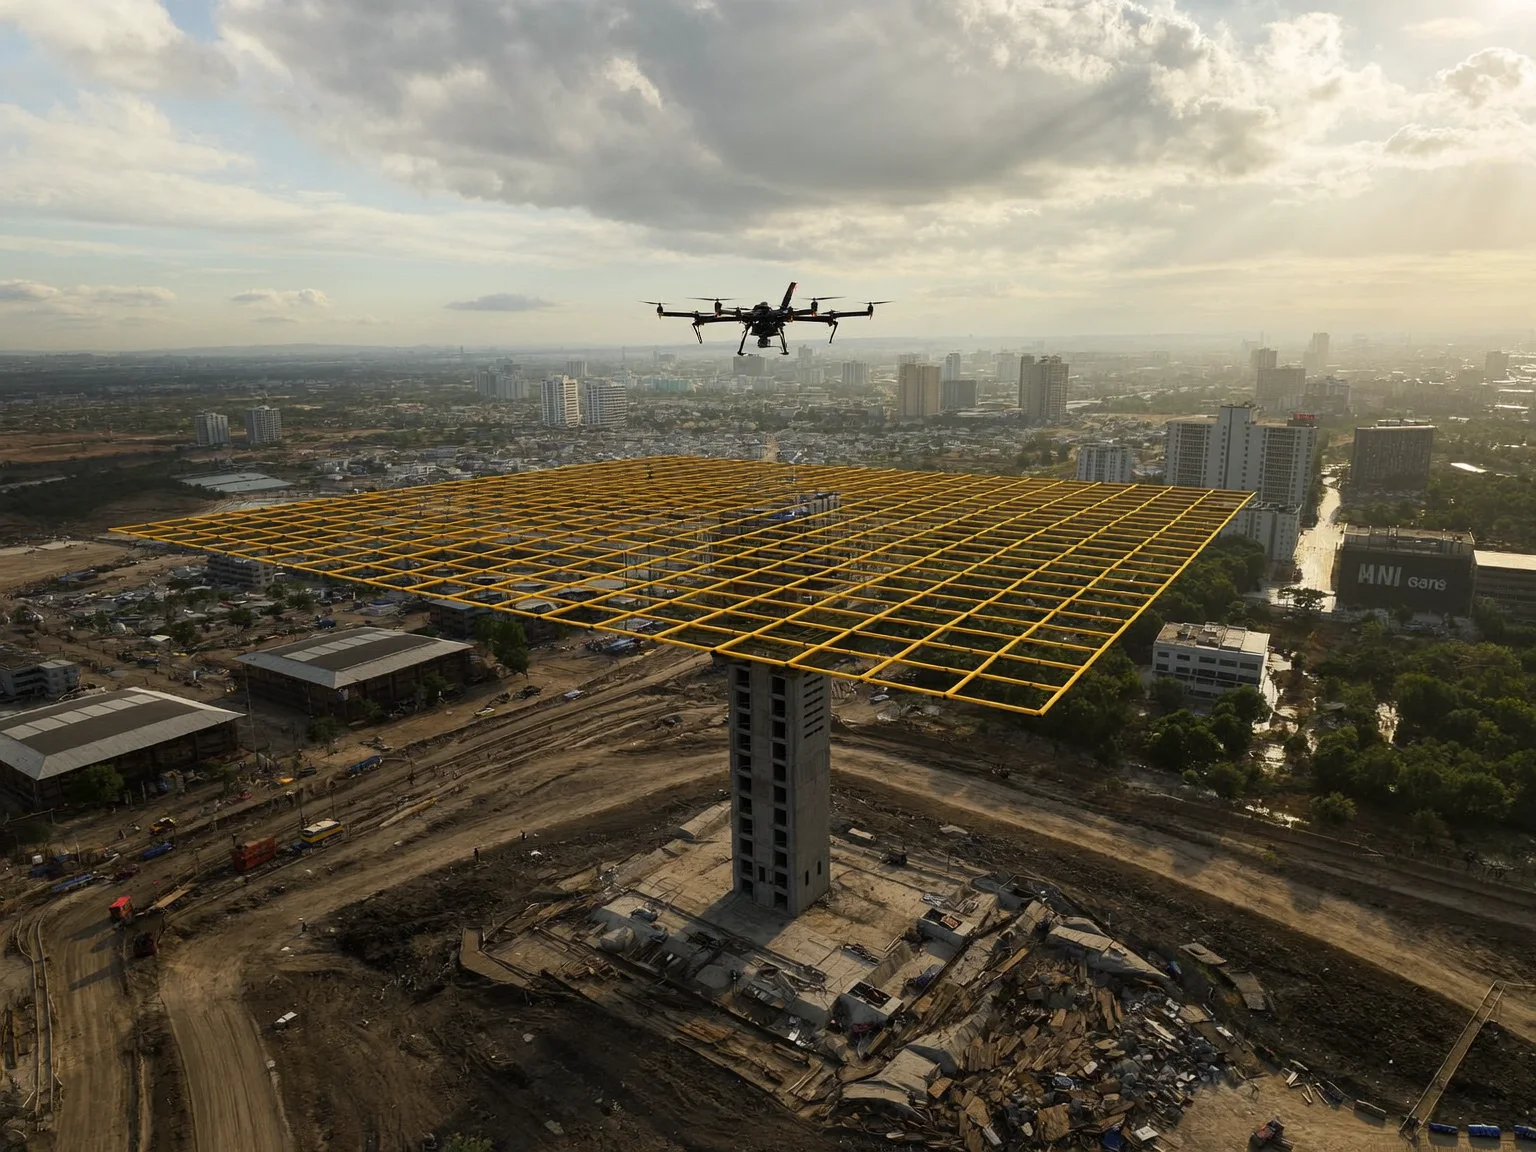
Overlapping drone photos are processed into a textured 3D mesh, a top-down orthomosaic and a dense point cloud. Engineers can measure heights, openings and stockpile volumes directly in the browser, and compare any two flights side by side.
- Mesh, ortho, point cloudStandard photogrammetry outputs you can export to your own CAD or BIM tools.
- Measure in the browserDistances, heights and areas taken straight from the reconstruction.
- Volumes and earthworksStockpile and excavation volumes calculated between flights.
Service 03
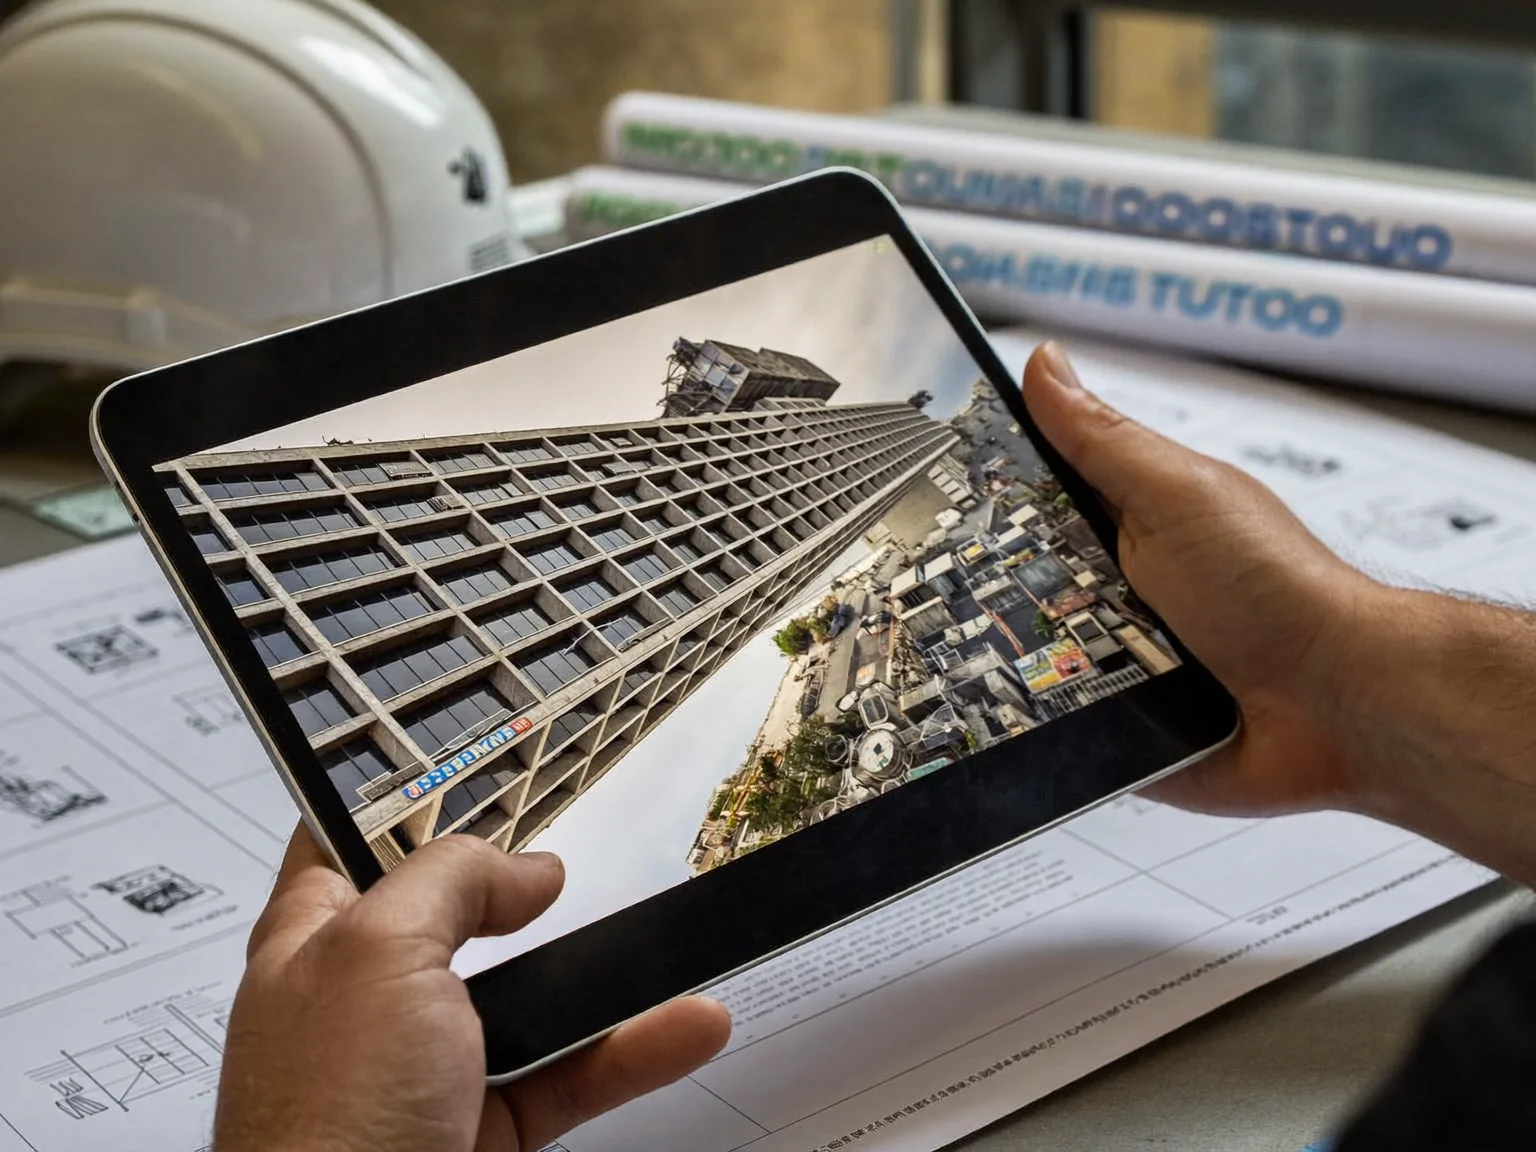
Upload the construction schedule, building permit and contract. control.io extracts every dated obligation into a milestone list and links each one back to the page it came from, so the comparison with the drone evidence rests on the developer's own documents.
- Milestones with citationsEvery extracted date points to the source page and line for audit.
- Schedules, permits, contractsWorks with PDF programmes, scanned permits and contract annexes.
- Human review built inAn engineer confirms the milestone list before it is used in a report.
Service 04
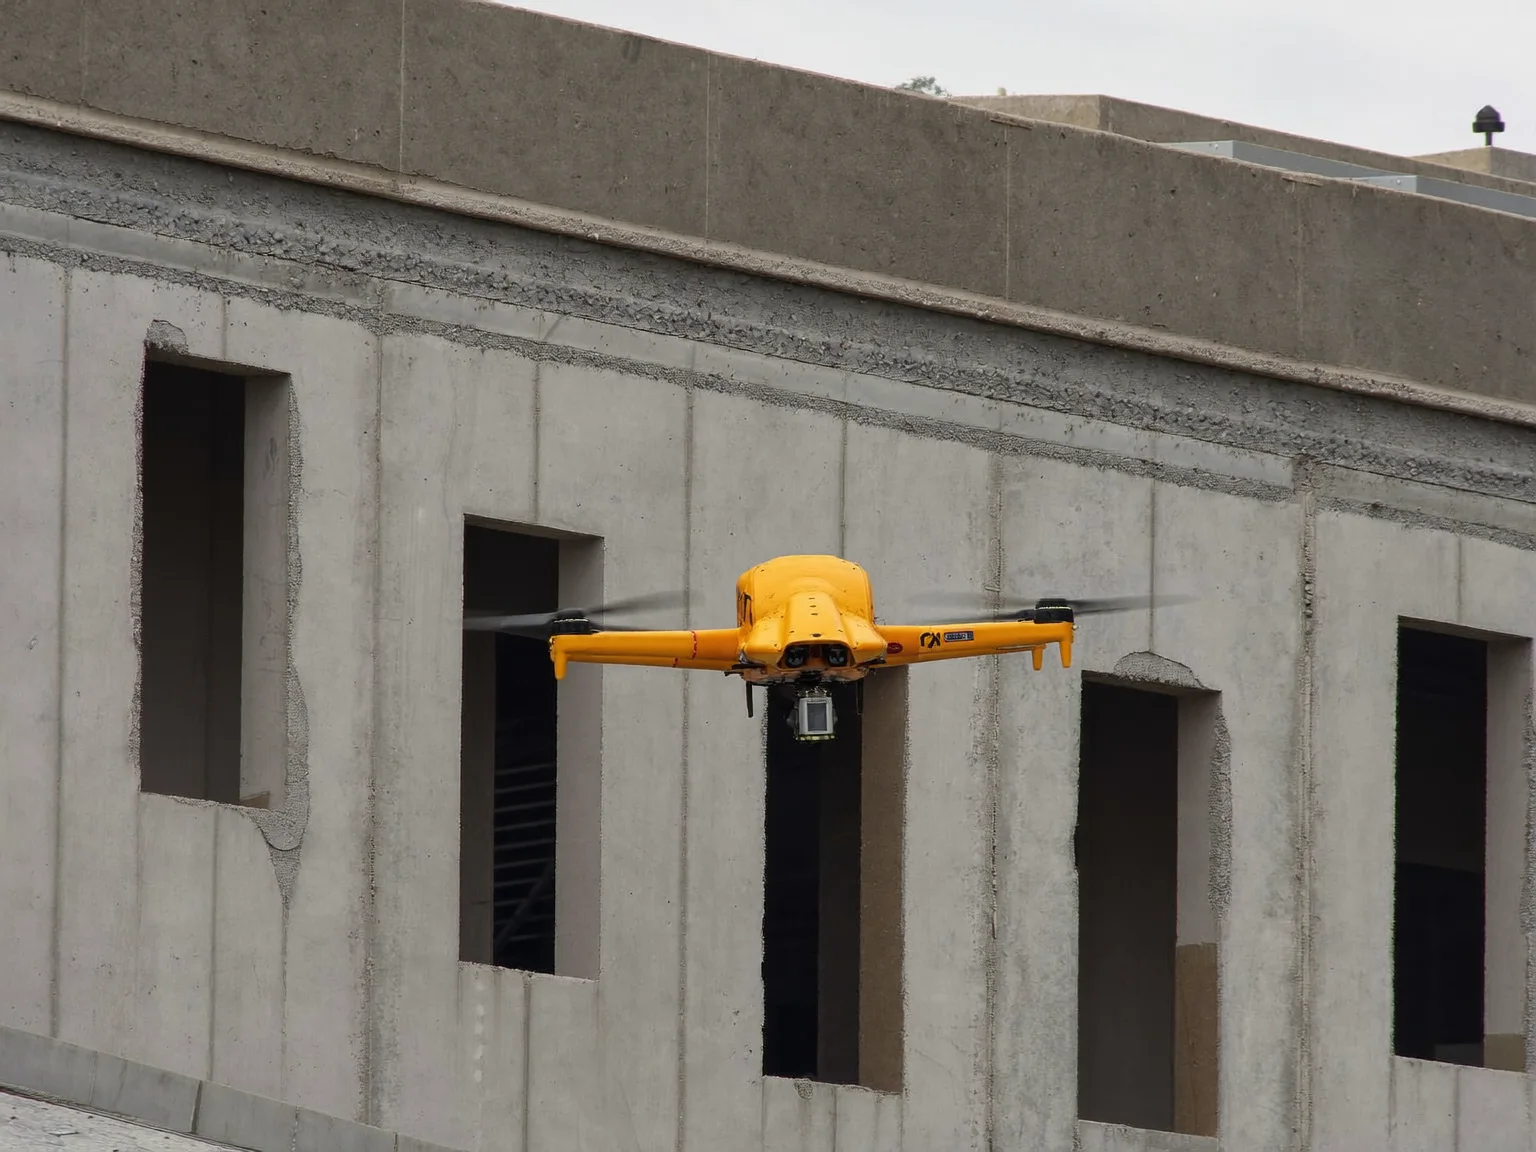
Vertical facade passes at a fixed stand-off distance produce high-resolution images of every elevation. Defects are tagged on the 3D model by floor and grid line, so the contractor receives a location, not just a photo.
- Located on the modelEvery defect pinned to a floor, elevation and grid position.
- No scaffolding or rope accessSurvey tall elevations without closing the site or the street.
- Before-and-after proofRe-fly the same pass to confirm the defect was repaired.
Service 05
Stakeholders follow the project in a live dashboard between flights. After each flight control.io issues a PDF report that lists every late milestone, shows the drone image that proves it, records a SHA-256 hash of each photo and annexes the schedule pages it relies on, so the report can be checked independently.
- SHA-256 per imageEach photo is hashed at upload so later tampering is detectable.
- Documents annexedThe cited schedule and permit pages travel inside the report.
- Live feed between reportsFlights, verdicts and alerts appear in the dashboard as they land.
Service 06
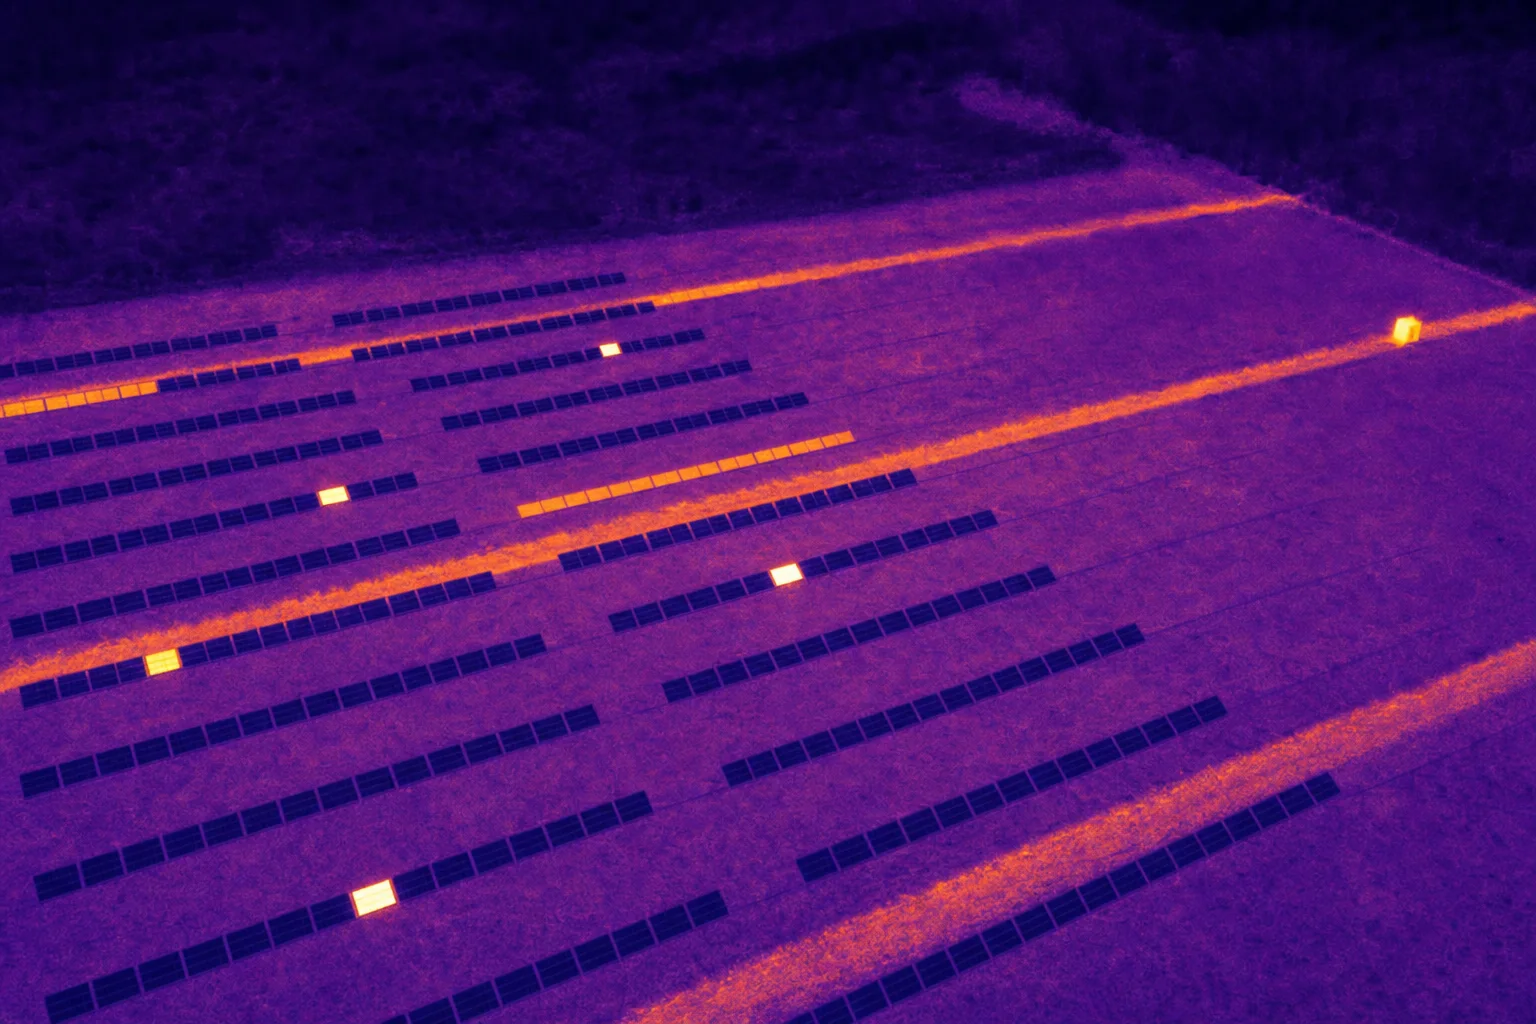
A radiometric thermal camera and an RGB camera fly the array together. Anomalies are classified along the lines of IEC TS 62446-3 (hot cells, active bypass diodes, open strings, soiling, vegetation shading) and each one is pinned to a module on a geo-tagged defect map, delivered with a PDF report.
- Thermal + RGB togetherHeat signatures are confirmed against a visual image of the same module.
- Per-module defect mapEvery anomaly geo-tagged to a row, table and module position.
- Prioritised PDF reportAnomalies ranked by class so O&M crews fix safety issues first.
Tell us about your site and we will suggest a flight plan.
We fly
A certified pilot flies your site on a saved route within your first month.
We compare
Your schedule is read, cited and compared with the 3D model, floor by floor.
You decide
A PDF delay report with hashed evidence lands in your inbox and dashboard.